Today it is my objective to post some understanding as to why, in betting, we all experience good and bad runs (‘gusts’ or ‘streaks’ as they are commonly known), and in doing so I will not return to the default argument that ‘tipsters are human after all and are not machines etc etc.’ I have read many articles of this opinion and they contribute very little in terms of using clear, developed and real statistics to back up this point. I would also like this article to assist in managing own our good and bad streaks (as well as those experienced by tipsters) and to lead firmly to the conclusion that gambling can in fact be a business and an investment LP.
We know that gusts/streaks or whatever else you want to call them are closely related to the concept of “variance”. If you are not able to understand that gusts/streaks affect all of us (and I will give an example of someone with a very good hit rate of 57.5% to emphasise this point), then you are simply not prepared to devote yourself to this type of practice, or indeed to “understand” betting at all, although it is not an exact science unless we have a detailed statistics base which is able to explain many phenomena, including this.
Nobody, I repeat nobody, no matter how much they are paid, whatever their historical statistics show, how well they know the platers, teams and leagues on which they bet, is able to use BIG MARKETS with HIGH LIQUIDITY to achieve a hit rate of over 60% several years in a row over hundreds/thousands of picks. They may have a good year – 62% for example – but will never experience 3 or 4 years at that level by betting on BIG MARKETS with HIGH LIQUIDITY and by SPREAD BETTING or on the ASIAN HANDICAP. I do not want to include minority markets in this analysis as they are not fluid and the advantage of discovering expected value is much higher, while it is also possible to possess greater knowledge than the bookmakers.
As I have already said, eventually our results will follow a curve if our outcomes are good and we bet on a par at odds of between 1.90 and 1.95 (approximately). In this way, our hit rate will be at between 55-57%, which I must also repeat are the results of a VERY GOOD BETTOR. Everything else above is either a lie, or more likely the result of a gust/streak encompassing a season, half a season, a month or whatever story these statistics are trying to be sold as telling, and this must be taken into account. Anyone who is actively following the promise of a 75% hit rate or yield of 50% is clearly a novice (so therefore has an excuse) or, worse, is blind and only seeks easy money which does not exist. These words may sound harsh, and I apologise for the tone, but I only use them to prevent good yet naive people from losing their hard-earned money.
I will justify my words with an example that shows us how we can better understand what happens with betting results over time.
Let us consider a tipster, forecaster or bettor who has a hit rate of 57.5% (which is very very good) sustained over two seasons in which he or she has made in excess of 1000 tips each season (let us say 1000 in the first and 1100 the second). Again we must consider that these are exceptional results, and we must consider these as a hope for our expectations or expected probability. Would it not be sensible to believe that with this kind of profile (a successful hit rate or yield) and with such an extensive knowledge of the market, this individual could have a run over the next 21 picks that is either better than this 57.5% hit rate, or indeed experience a bad run coming in at a much lower %?
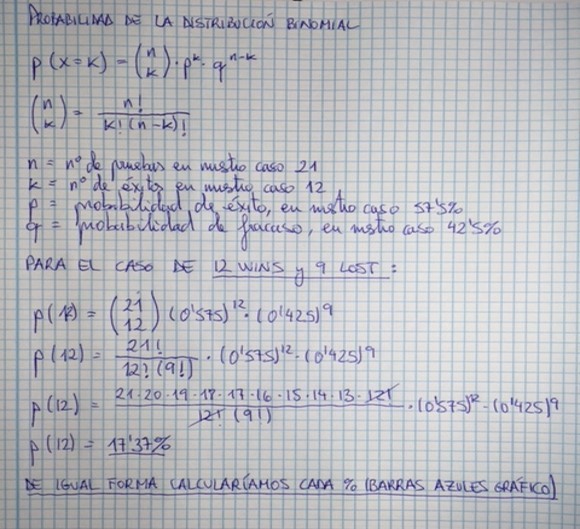
We can analyze this from the perspective of a distribution binomial with which we can calculate cumulative probabilities for a particular range of odds, on the basis of the following formulas.
I propose first to remove the likelihood that the tipster will achieve a streak of 12 wins and 9 losses from the upcoming 21 picks.
First I refer to the graphic of my notes below as it is difficult to express some formulas in any other way than written by hand. This formula expresses the probability that comprises a ratio of 12-9 from the following 21 tips at a hit rate of 57.5%
Once we know where to leave the calculations you can formulate the graph with several intervals calculated in the same way (for each bar I have made the same calculation as in the notebook equation above… for example in the case of 15W and 6L it would be almost 8%, etc). What we can see is that the gusts/streaks are concentrated around the likely interval on the basis of the hit rate or expected value having a “tail” which is a little “longer and more pronounced” in the case of a positive streak (all of the time referencing the hope of achieving 57.5%). BUT THIS DOESN’T REMOVE THE FACT THAT WE FACE OTHER GUSTS/STREAKS WHICH CAN BE VERY DIFFERENT, AND BY THAT WE MEAN GOOD OR BAD!
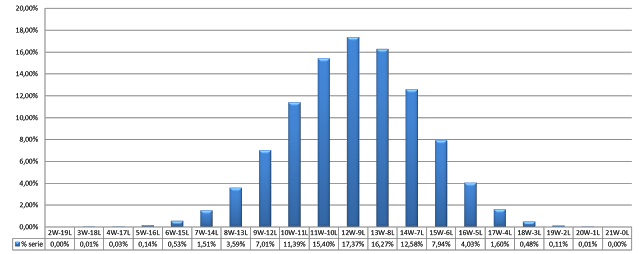
Once we have this chart we can also calculate the table of worst-case scenarios (gusts/streaks) expected, calculating it by adding bars from left to right and which would thus accumulate as follows:

It is also important to think about something else…we have calculated gusts/streaks at intervals of 21 in 21 events that are advancing. If we take the example and decide to perform an analysis for a set 21 parties this will create a static picture, but if we do it for the following 21 picks we will find 2079 possible intervals of 21 events from the following 2100 picks. I will show you a more visual example in case I have not explained myself very well…

That is to say, from 2100 picks we have 2079 different series of 21 consecutive events that meet the different gusts/streaks, if you follow my logic?
And therefore in these 2079 different series the probability of finding ourselves with a 6-15 record or worse increases greatly when compared with a single series – it is all part of the “game” if we understand it well. Yes it happens…it happens that you do not want to understand this and instead you run with stakes and tipsters that lead you to failure. Imagine if an x number of accomplished tipsters were in agreement with each other and they made the same tips – it would be legendary. It is also always important to remember that it is essential to have optimal management of the stake, and for your betting portfolio to be balanced. Now you know this you are on your way to finding a tipster that can be legendary for you.
A word of advice is that so far I have not spoken about the fact that streaks also have a mental component, as obviously the tipster is human. I am not partisan to this element as it goes against our interests, but we hold them accountable to higher standards as we pay for their service and therefore assume they will constantly deliver profit
Remember that everything I have calculated so far is with a high hit rate at par odds. Now imagine if the hit rate of your tipster is less because the probability of profit is lower but the odds higher, even though they perform well with these odds…the streak will be much greater! This also happens if we bet with lower odds and with higher expected probabilities.
The impoartance of this article and the numbers contained is not to remember it exactly, but instead to juust keep it in our minds and maintain confidence in a tipster even during times of bad streaks. Please bear in mind that this is normal, and what could possibly be more important that the rules of the game of betting?
In the same way I hope I have encouraged positivity and emphasized the importance of not despairing when an unsuccessful tip is given. Indeed, after a good run will come another run that is not so good. Beware also increasing stakes when a tipster is on fire (as gusts/streaks are not eternal). Whoever does not want to understand it or accept it will lose their investment LP with stunts such as changes in stakes, tipsters, etc. Always be professional.
Another issue should be considered is the analysis of whether a tipster is on tilt or similar…but that’s another story and will be dealt with in another post.
Thank you taking the time to read this and for continuing to help me to grow, if you’ve provided I would appreciate broadcasting.
Please follow me at @bigdatabets and on my Telegram Channel where I will offer value picks for free.
Soon you will also be able to find me on Bet Advisor with my value picks…