It is obvious that if everything were based on following a good or a bad streak of a team in any of the available markets in the bookies, we would all be millionaires, but we are not and there must be a reason…The fact that a team has won its last 10 games at home does not guarantee that it will win the eleventh. Or that during 5 games a team has scored more than 1.5 goals, will not guarantee that during the sixth one it will score 2 or 3 goals, too.
Let’s not forget how much it has been written about the player’s fallacy and independence between events, which is a reality. So far, I think we all agree that, although sure enough you must have previously read that a streak is almost the only argument to continue betting in favour of the next streak, we forget that they play a new game, different from the previous ones, with another team which that can have even a better or worse streak, and analyse how those defeats or victories were.
Football is a game in which 2 teams confront each other and both have past stats that we must keep in mind, if not to predict the future, to study probabilities and assess the chances for both of them.
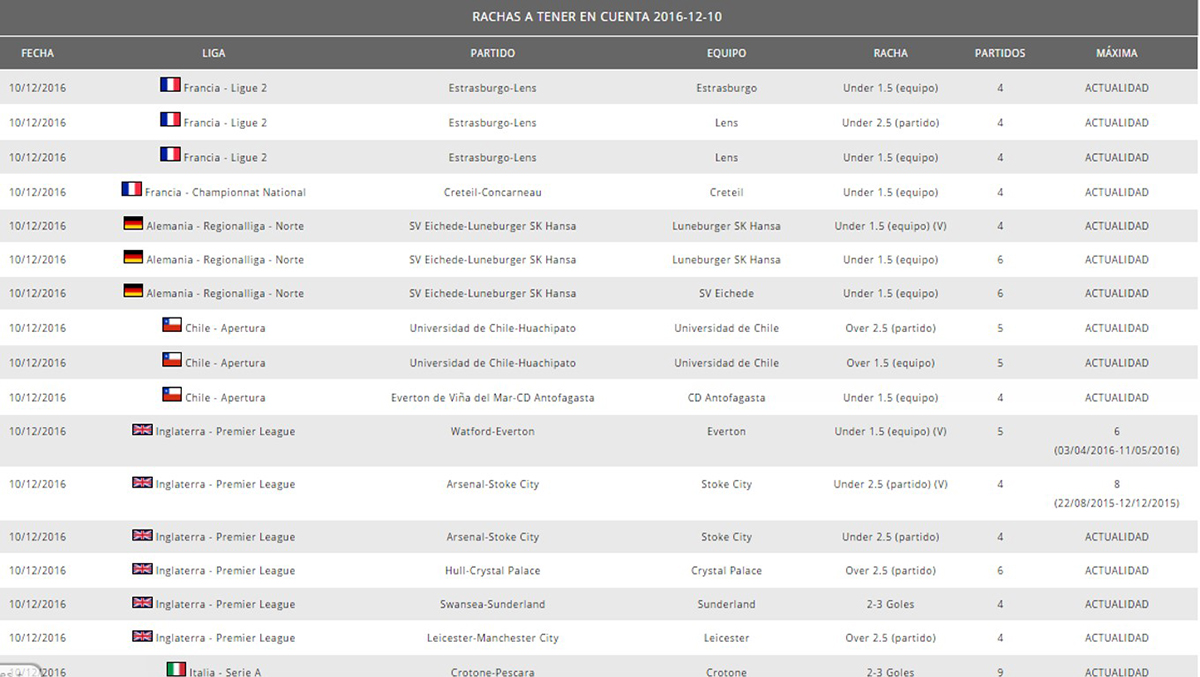
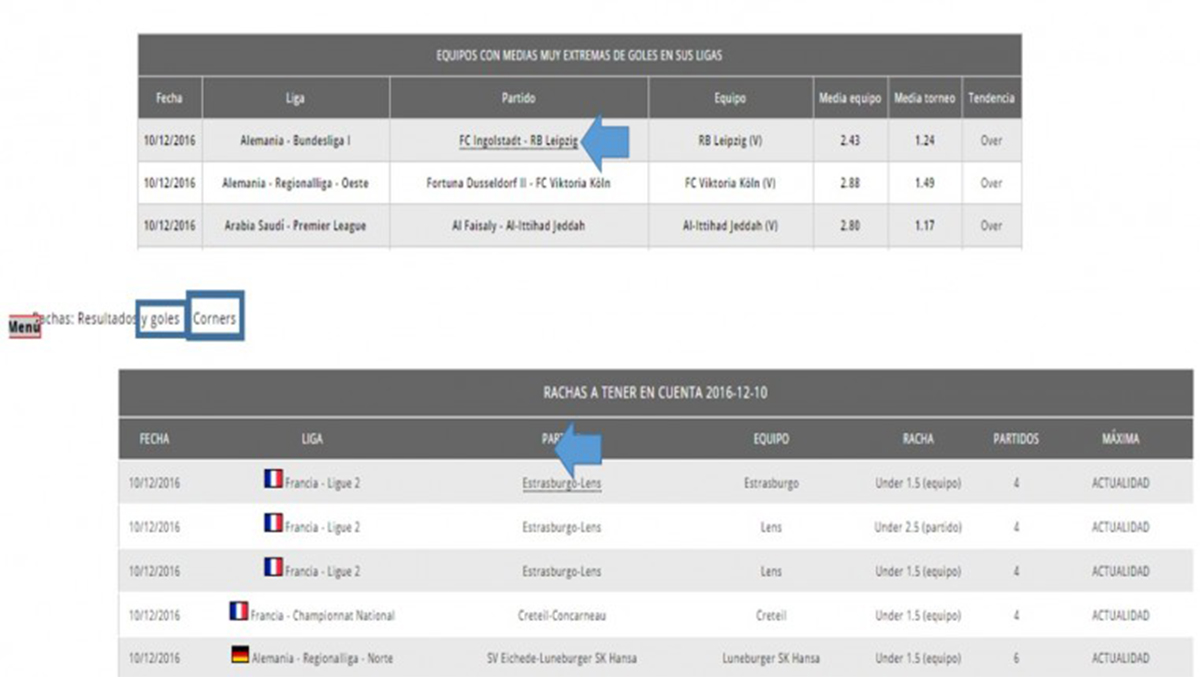
However, a good run can be a “good” indication that a team is in good shape and vice-versa, if we talk about a bad run. In fact this is one of the reasons why we think that we should include in Betdatastats.com an option, which could warn about what streaks and extreme averages we should take into account. It would be of great help, if we focus on those games, without having to analyse the whole grid of the daily games. Now, once we have those streaks to a single “click”, if we need to be able to analyse whether we will follow it, dismiss it or include it, it is highly probable to go against it, because the value is on that side.
http://www.betdatastats.com/ayuda.php#Rachas
http://www.betdatastats.com/ayuda.php#MediasExtremas
And to make that decision, it is very important to rely not only on the team that shows that streak. We must analyse the other team that will be the rival or not, and also other very important elements such as the average data of the competition, the position or the ranking that the team occupies in the same market, confronting with teams of the same potential, etc. in addition, all of this information can be available to you by clicking on the match, where you have both of the options, for the goals and corner markets.
Apart from analysing everything I have mentioned, we have another very important variable to include within the equation, the odds. The odds can lead to the fact that, what we consider an opportunity, might be not, because it lacks value related to the probability that we give to the possible or probable continuity of the event that we are studying.
I will try to develop all of this, with a few examples by using some calculation tables, so that you can find in many websites, which is the best way I think you will capture what we want to convey.
We will start with a couple of examples from the 1 × 2 market:
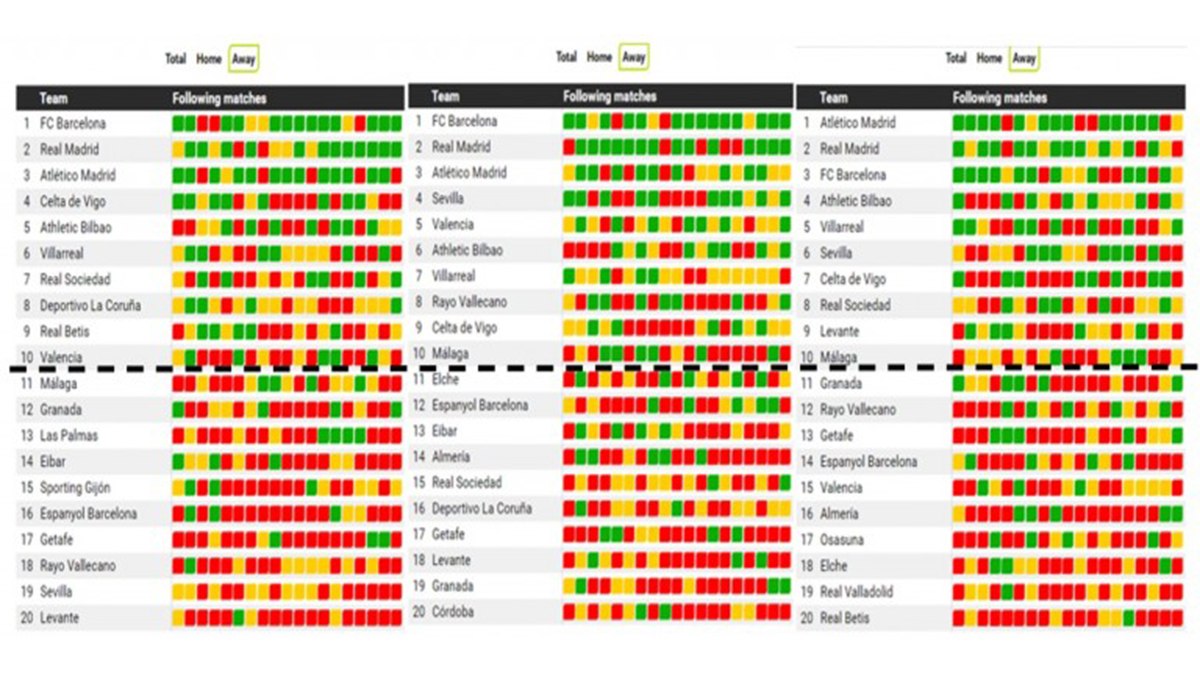
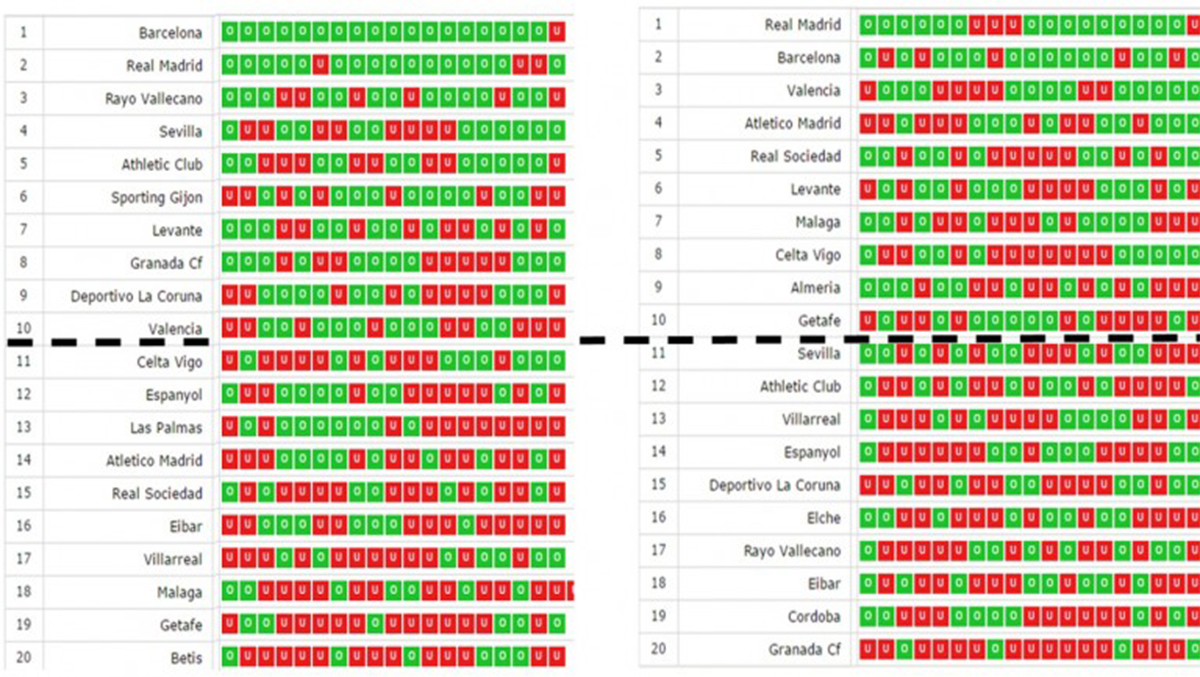
What you see in the image are the sequences of the away matches, ranked in chronological order by rows in the last 3 leagues of the Spanish Primera Division (I would be worth any league, as the one I explain here, is even stronger than the 2nd French, Spanish or Italian division, etc). Let’s focus on this image, but I invite you to do the same with other leagues, with any web that visually offers these data, which can be seen quite well.
We draw a line in the middle of the table and study the patterns that follows a league year after year. What I want you to value is the number of greens that the teams from the middle of the table can do … we could put other 3 or 5 years and the response and the pattern would be the same. There is a high % of series with the maximum a green, a minor % of series with 2 consecutive greens and there is less probability, or to find events in which there have been 3 greens.
This is not a play to guess something. It is a reality that repeats year after year. As I said in the beginning, we are clear that the events are independent and we are not falling into the player’s fallacy. We only contrast a reality and a pattern that repeats year after year. When the teams of the lower part of the league, play away, they have a very definite pattern. It is obviously impossible to know when they will achieve the “green” (success), but it is demonstrated that year after year that a team plays away, it is in the lower part of the table and doesn’t have a very high % of victories and the number of times it wins consecutively, tends to a maximum and minimum value (which is also calculable for the current year, but we can analyse situations of a competition during all of the last years).
These data can generate a value to go against it. Imagine a team that plays its last matches away, can have a lower closing odds, than if they had lost all. Another issue to take into account is to see what have been their last rivals. A streak of 4 losses in consecutive weeks for a team that has played with Real Madrid, Barcelona, Atletico de Madrid, etc, is normal and vice-versa…
We propose another example:
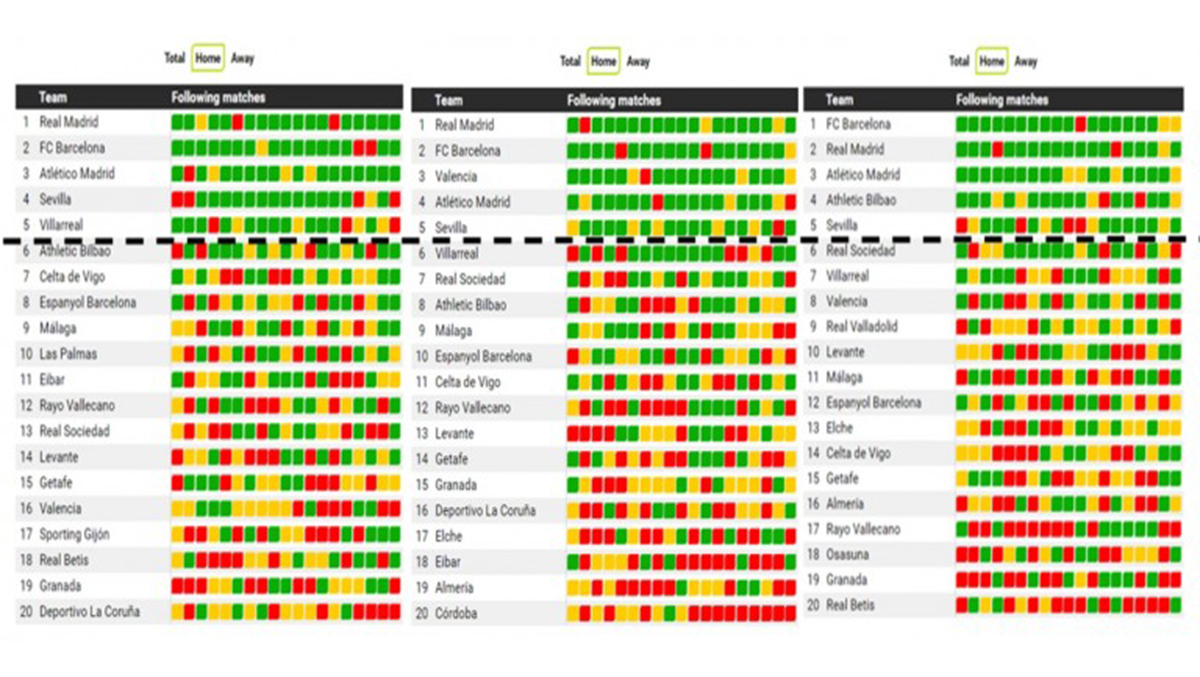
In this case I have drawn a line above the sixth ranked and we are talking about matches played locally. As you see, it is the totally opposite case to the previous one. It is difficult to find 2 colours different from the green, in relation to the year and more difficult to find 3 consecutive “no wins”. This happens year after year in first-class leagues, where the % of home victories estimated at the beginning of the season is very high, it is clear that we can find 2 or 3 “no win” for Real Madrid, Barcelona or PSG at home. But I insist that the patterns show that the probability is better. Imagine that we could make a combined of 3 consecutive games in Bernabeu, betting against Real Madrid. The odds would be very high and therefore, the probability that the bookies give to that event would be high.
Now if you think we are going to look for a similar table of the goals market, a table in which the teams appear ranked more or less over 2.5, which is the sequence in which they make over 2.5 goals per game during the last 2 seasons, in this case, I beat you the tables of “over” home results during the recent years in the league ranked from the highest to the lowest % of overs 2.5:
In this case you can do a reading similar to the previous one. Look at the “over” sequences of the teams, if we draw a line on the middle of the table. Below we see that it is difficult to find a long sequence, and what in this case would be good to study is that, if in previous cases the streak of that team (in other seasons) has been longer or not, obviously a streak in which Barcelona scores in 4 consecutive matches at home, with more than 2.5 goals, is not comparable with what another team from the bottom of the table does,. That is why we think that it was important to have an indicator that will concretely show us the “maximum streak” of that team, in a particular event, during the recent years.
We can do the same reading with the teams that are in the top of the tables. A consecutive streak of 2 under 2.5, in the Bernabeu or in the Camp Nou, occurs with a smaller frequency than in another stadium. But this is football and everything can happen. Even if you analyse these tables year after year, you will see that there is a % or probability associated with each event and that more or less long events are repeated by teams and an average of the competition is maintained. These already commented data as already commented, are available at a click, either for the market of corners, or for that of goals, in our separate streaks and the extreme streaks (see image 1 of the post).
With this short summary I try to explain how to make a possible reading of the streaks that we offer daily in our web. I repeat that, it is not a question of following them or of go against them. The question is to have them at a click and focus on them. For me a very big competitive advantage in time vs stake. The ideal is to see if those wins or defeats and especially the last ones, correspond to a bad game of the team or if on the contrary, they have been the result of variance, or of events, or of specific events, absences of important players, penalties in favour of or against, goals in the last minutes, etc., You already have the clue that we give you. Now we have only to see where we can still find any value.
Having said all this, I would like to conclude with some reflections and clear examples that make us look at the value concept!! I recently read a couple of very interesting articles on the sports in the USA that I share 100% and that are comparable to our case. I have even found USA sports payment services based on sending picks with a minimal streak in favour of the team in some markets.
The article spoke of some important points of view to consider. On the one hand it dealt with the type of sport, specifically about the number of players competing for each team, the smaller the number of players competing in the team game, for example in the NBA (or basketball in general) there are 5 in court (Vs NFL, rugby, soccer, etc.), the “easier” is the fact that all be going through a very good individual form, or vice-versa, and thus you see more long series in the team (both positive and negative ones).
On the other hand, something very important to be taken into account, is the value that can be found in the series in favour of a team, either in 1 × 2 or ML, in Asian Handicap or goal lines, etc. The more adjusts the streak of a team, in particular the price/odds that the bookies offer us (and that is a fact), first because the starting prices adjust too, and second because the market does the rest and the general public starts to follow them and makes them lose more value …It is impossible to know when a streak is going to break, but in many cases the value is usually on the other side.
There are little things that go against a streak like h2h or against totally objective and non-statistical elements. I am giving you a datum from the previous seasons going against an AH. A team has covered it in 5 or more occasions and it has had a hit rate close to 60% in NBA. A year ago we did a similar study with the lines in European leagues and they were similar, except in leagues with large imbalances or “contaminating elements”, as teams with data far from the average, that make these series longer (in a few weeks we will offer you data for Handicap lines and goal lines in betdatastats).
To resume, it’s important to see the tendency and series of both teams, if the sequence is at historical highs or if it still has a run, as it has happened on other occasions (pattern analysis) and obviously if there are other conditions that may go against our first evaluation (attention paid to the last days, level of opponent teams, injuries or line-up of first-team players, motivation of both teams, etc.). The stats are important, but still more important is to interpret them well, put them in context and analyse other objective values from those that are available to us and of course, none of these analyses are useful, if we have estimated for the event a probability that is smaller than the one that offers us the bookmaker through the odds. Never forget the value concept. We are analysing the section that you want from our web, either possible bets, series of the day, or extreme fluctuations.
NO tratamos de jugar a saber lo que va a pasar, NO pensamos en que un suceso condiciona el siguientes, tratamos de encontrar probabilidades mayores a las que ajustan las bookies analizando rachas, patrones y desviaciones extremas sin olvidarnos que evidentemente cuanto mayor sea una muestra mejor fiabilidad tendrá.
We DON’T try to play to know what is going to happen. We DON’T think that an event conditions the next one. We try to find greater odds than those adjusted by the bookies, by analysing series/streaks, patterns and extreme deviations, without forgetting that evidently the bigger the model, the better its reliability.
Thank you for being there and for continuing to give me your support. Here at betdatastats.com we keep on working and improving. And remember to bet with responsibility and without incurring over betting. There are days when we offer a lot of data or streaks, but they are nothing more than the result of a reality. That day many events are celebrated and just as before without having access to Betdatastats, do not bet on everything, now also, despite having an important advantage over the rest.
Remember follow me on twitter @bigdatabets and on Betadvisor
https://www.betadvisor.com/es/tipsters/football/merlin-football.html